

Artie can send the same metrics to Datadog, or to New Relic, Amazon CloudWatch, Grafana, or any OTLP endpoint through the OpenTelemetry integration, where you can build your own dashboards and monitors.
Available filters
For each of these metrics, you also have the ability to set a filter:- Pipeline (All or a specific pipeline)
- Specific tables (This is available if you specify the pipeline)
- Whether to include or exclude backfills
- Mode (Replication or history)
Metrics
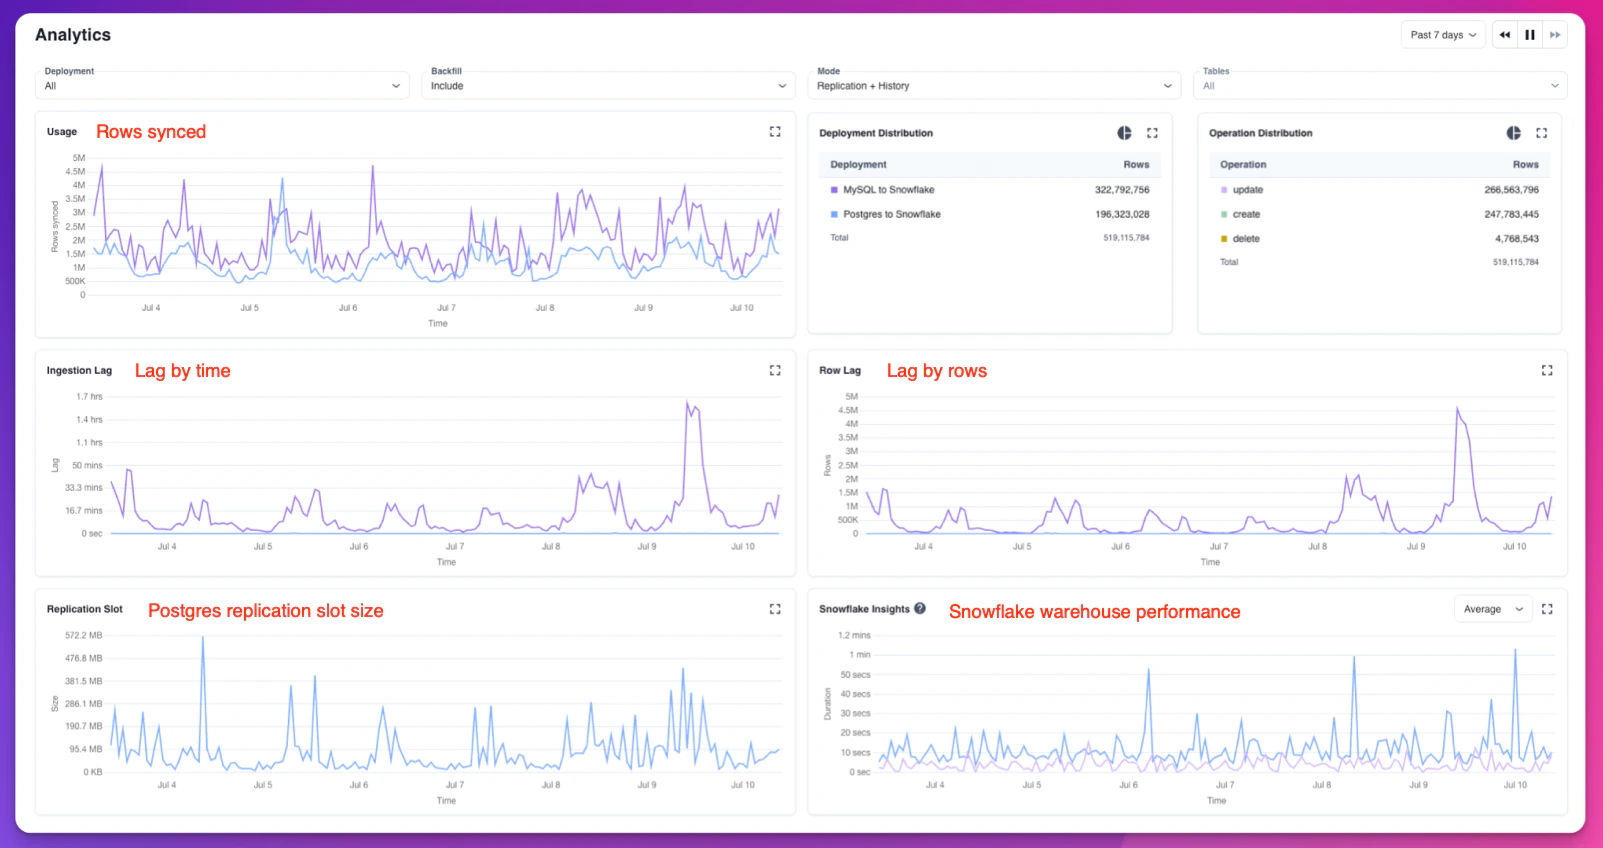
The following metrics are available in the Analytics Portal:- Rows synced over time
- Type of operation (create, update, delete, backfill)
- Table distribution
- Ingestion lag based on time
- Ingestion lag based on number of rows
- For Postgres, we’ll also graph your replication slot size
- For Snowflake, we’ll monitor your virtual warehouse’s queued and execution time
Query metrics with the API
The same metrics are available fromGET /analytics with an API key. Pass a time window, the datasets you want, and optionally a pipeline:
time is a Unix timestamp in milliseconds, and value is in the dataset’s unit. Check err on every dataset: one dataset can fail while the others succeed.
Dataset names are case-sensitive, and unknown names are ignored.
Total lag (source to destination) is
readerLag plus ingestionLag at each timestamp. Ingestion lag is only reported when Artie flushes, so treat a missing point as 0, which is how the Analytics Portal draws its total lag chart.
API keys scoped to one environment must pass pipelineUUID. Requests without it return 400, and a pipeline from another environment returns 404.