*.row.lag | Difference between Kafka’s high watermark (which is at the partition level) and the current message offset. | - | groupid, topic, partition, table, mode |
*.ingestion.lag.95percentile | p95 of time lag from Kafka message was published and received.
Since Transfer 1.4.6 | ms | groupid, topic, partition, table, mode |
*.ingestion.lag.avg | Avg of time lag from Kafka message was published and received.
Since Transfer 1.4.6
If self-hosting Transfer, this is a good metric to monitor. | ms | groupid, topic, partition, table, mode |
*.ingestion.lag.max | max lag from Kafka message was published and received.
Since Transfer 1.4.6 | ms | groupid, topic, partition, table, mode |
*.process.message.count | How many rows has Transfer processed. | Count | database, schema, table, groupid, op, skipped, mode |
*.process.message.95percentile | p95 of how long each row process takes. | ms | database, schema, table, groupid, op, skipped, mode |
*.process.message.avg | Average of how long each row process takes. | ms | database, schema, table, groupid, op, skipped, mode |
*.process.message.max | Max of how long each row process takes. | ms | database, schema, table, groupid, op, skipped, mode |
*.process.message.median | Median of how long each row process takes. | ms | database, schema, table, groupid, skipped, mode |
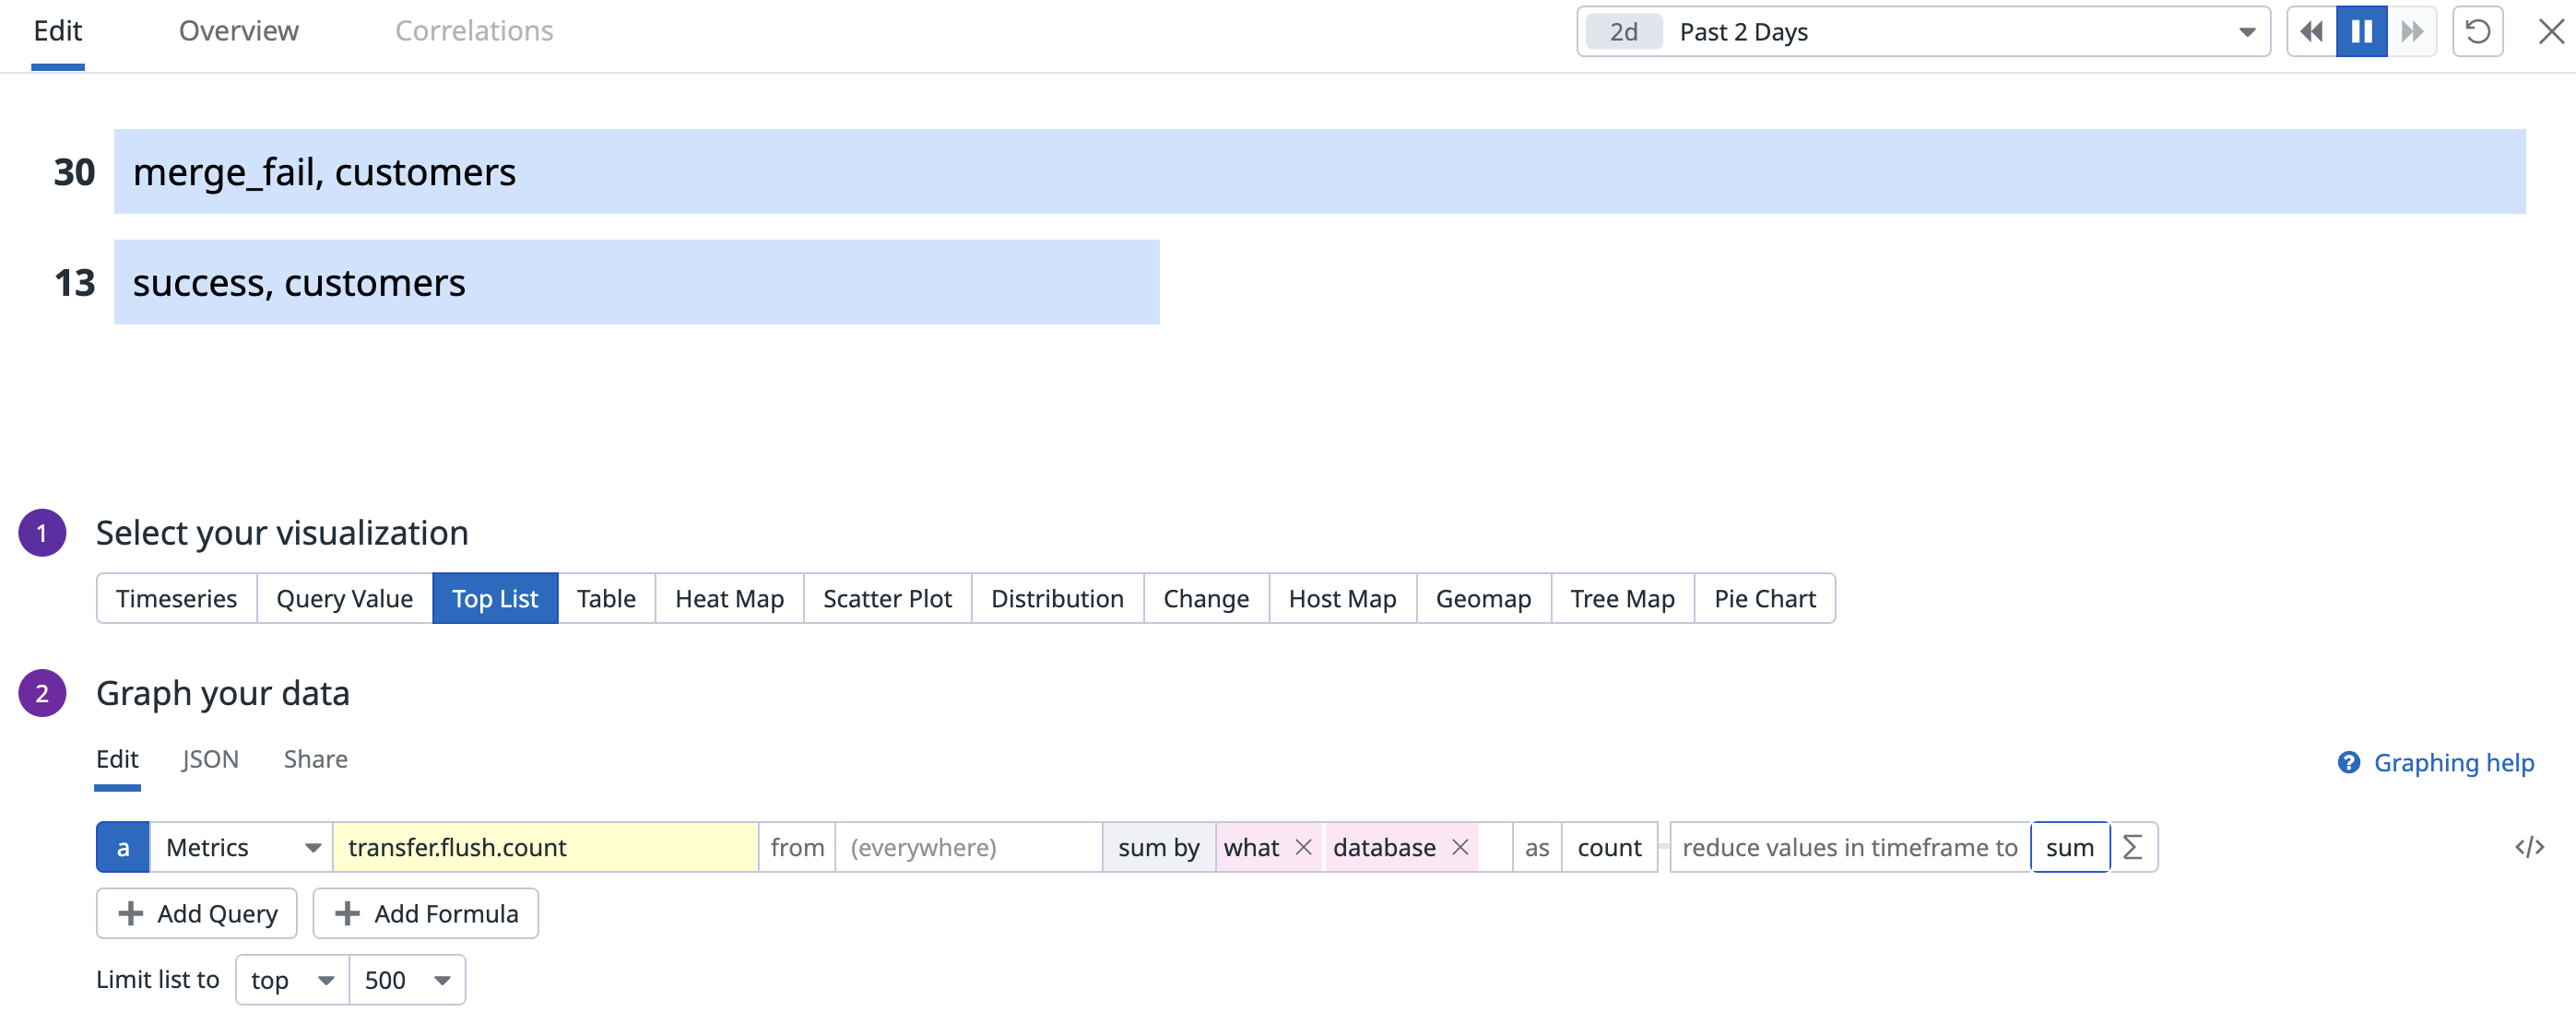
*.flush.count | How many flush operations have been performed. | Count | database, schema, table, what, reason |
*.flush.95percentile | p95 of how long each flush process takes. | ms | database, schema, table, what, reason |
*.flush.avg | Avg of how long each flush process takes. | ms | database, schema, table, what, reason |
*.flush.max | Max of how long each flush process takes. | ms | database, schema, table, what, reason |
*.flush.median | Median of how long each flush process takes. | ms | database, schema, table, what, reason |