Building Production-Grade Webhooks with Retries and Streams – Without Breaking Your Data Pipeline
Artie is a fully managed real-time streaming platform that continuously replicates database changes into warehouses and lakes. We automate the data ingestion lifecycle, from change capture to merges, schema evolution, backfills, and observability, while operating at production scale.
TL;DR
Firing webhooks directly from pipeline code turns external endpoints into part of your critical path. If a webhook endpoint is slow, misconfigured, or down, inline delivery can block ingestion, amplify retries, and interfere with real-time replication. We avoid that by writing every pipeline state change to a durable Redis Stream and deriving alerts asynchronously through workers that handle retries, prioritization, and monitoring windows. The result: reliable webhooks without slowing production replication.
Why We Decouple Ingestion from Notification Delivery
At Artie, we run real-time replication with sub-minute latency. When data is moving that fast, visibility matters just as much as throughput. If a pipeline pauses, a connection drops, or replication lag spikes, customers can’t find out hours later – they need to know right away.
But detecting change isn’t the hard part. Modern systems emit plenty of signals. The real challenge is deciding which of those signals deserve to wake someone up. A ten-second network hiccup shouldn’t page an engineer. A sustained replication failure should.
So we built our webhook system around that distinction.
Instead of firing notifications directly from pipeline code, we write every state change to a durable event stream. From there, we process events asynchronously, apply monitoring logic over time, and only then decide whether to notify a human. Webhooks become a derived outcome – not a side effect buried inside core replication logic.
In this post, I’ll walk through how we built that system using Redis Streams, Asynq, and Go, and how this architecture gives us reliable delivery, controlled retries, and isolation from transient failures.
Why Webhook Delivery Shouldn’t Block Replication
The naive way to implement webhooks is simple: when a pipeline changes state, immediately send an HTTP request to the customer’s endpoint.
But that makes a third-party server part of your critical path.
If a customer’s webhook endpoint is slow, returns a 500, or times out, your replication system is now waiting on infrastructure you don’t control. Under load, those waits stack up. Enough of them, and webhook delivery starts competing with the data plane for CPU, memory, and connections.
We never want alert delivery to impact ingestion. A customer’s misconfigured endpoint shouldn’t be able to slow down their own pipeline – or anyone else’s.
So we draw a hard boundary.
Instead of firing webhooks directly from application code, every pipeline state change is written once to a durable stream. Alerts are derived later, asynchronously, as explicit decisions over time.
The Architecture
When we decided to build webhooks, we avoided embedding notification logic directly into our replication services. Instead, we extended our Events API to write pipeline state changes into a Redis Stream, which acts as a durable event log. Webhooks were then implemented as a consumer of that stream. Every state change is written once and processed asynchronously, rather than triggering side effects inline.
Every pipeline state change is written once. From there, different parts of the system consume those events independently: one path handles webhook delivery, another applies monitoring logic, and others power internal dashboards and alerts. Ingestion happens a single time; everything else derives from it.
This matters more than it might seem. The events that power customer-facing webhooks are the exact same events we use internally to operate and debug pipelines. There’s no parallel system for “external notifications,” no shadow logic, and no special-case code path that can drift over time. If an event exists, it’s in the stream – and everyone reads from the same source of truth.
Here’s what that looks like at a high level:
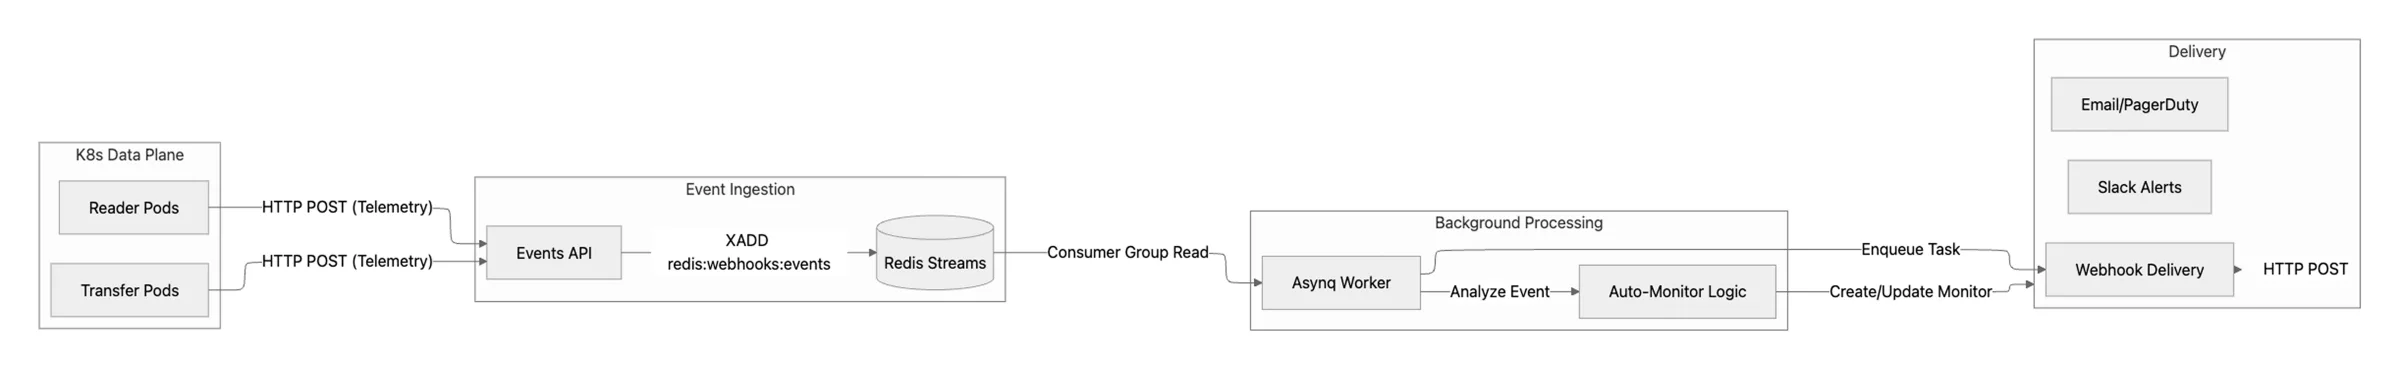
Key Components of the Event Pipeline
- Data Planes (Transfer & Reader): These are the replication engines running in Kubernetes. When something changes – a pipeline syncs, fails, or hits lag – they emit an event.
- Events API: A thin ingestion layer. It validates incoming events and appends them to a Redis Stream. No business logic, no side effects – just fast, durable writes.
- Redis Streams (
artie:webhooks:events): Our append-only event log. It buffers bursts of traffic and lets multiple consumers process events independently without losing ordering or durability. - Asynq Workers: Background workers that read from the stream and execute side effects – delivering webhooks, updating monitors, handling retries.
- Auto-Monitoring: The decision layer. Instead of forwarding every error, we evaluate events over time. If a failure persists, we trigger alerts. If it resolves quickly, we stay quiet.
Deep Dive: Events API to Redis Streams
When a pipeline changes state – say it transitions to pipeline_synced or hits a connection_error – the data plane sends a structured event to our internal Events API. That API does two things: validate the payload and append it to a Redis Stream. That’s it.
We use Redis Streams as an append-only event log. Every state change is written in order and persisted. Ingestion ends at the stream. Side effects happen later.
Why not just use pub/sub?
Because pub/sub drops messages if a consumer is offline. Redis Streams don’t. If a worker crashes, restarts, or falls behind, the events are still there waiting to be processed. We can replay them. That gives us durability and recovery without complicating the ingestion path.
More importantly, writing to a stream separates ingestion from side effects. The data plane’s job is to report what happened – not to decide whether to fire a webhook, retry a request, or suppress noise. Those decisions happen later.
Event Schema & Normalization
Every event is normalized into a consistent shape before it hits the stream. That might sound minor, but it’s what makes everything downstream predictable.
If your events are inconsistent, your monitoring logic becomes a pile of special cases. We avoid that by enforcing one structure at the boundary.
When the Events API receives an event, it validates the payload and then appends it to the redis:webhooks:events stream using Redis’s XADD command. From that point on, the event is durably recorded and ready for consumers to process.
Parallel & Safe Consumption with Redis Consumer Groups
Once events are written to the stream, we need to process them safely – and in parallel. A single worker reading from the stream would quickly become a bottleneck. But simply spinning up multiple workers and letting them read independently isn’t safe either; without coordination, the same event could be processed more than once.
Redis consumer groups give us controlled parallelism. Workers join a shared group, and Redis assigns each event to exactly one consumer at a time. When a worker reads an event, that message moves into a pending state and stays there until the worker explicitly acknowledges it. That acknowledgement is the signal that processing completed successfully.
This model gives us at-least-once processing semantics. In practice, that means an event will never silently disappear. If a worker crashes halfway through handling a webhook, the event doesn’t get lost. It remains in Redis’s Pending Entries List, waiting to be reclaimed.
After a configurable idle period, another worker can claim that stalled event and continue processing. We configure our dashboard:webhooks consumer group to automatically reclaim stale messages, so a single dead worker can’t block the pipeline.
Why We Use Asynq for Task Execution
Redis Streams and Asynq play very different roles in this system, and keeping those roles separate is intentional.
Redis Streams is our system of record for state changes. It’s an ordered, append-only log optimized for durable writes, replay, and consumer recovery. It’s great at answering the question: what happened, and in what order? But it’s not designed to manage retries, rate limits, or execution policies around side effects.
That’s where Asynq comes in.
Asynq handles task execution. It gives us structured retries with exponential backoff, queue prioritization, rate limiting, and visibility into in-flight and failed work. Those are execution concerns, not ingestion concerns – and we keep them out of the ingestion path on purpose.
In practice, the flow is straightforward. An event is written to the Redis Stream and acknowledged. A worker then reads that event, derives one or more tasks from it, and enqueues those tasks into Asynq. From that point on, webhook delivery and alerting live entirely inside the task queue.
That separation is what protects the system. If a customer endpoint is slow, or retries start backing up, ingestion continues unaffected. We don’t block replication because a webhook is misbehaving.
Bridging the Stream and the Task Queue
The worker service runs a dedicated goroutine that continuously reads from the Redis Stream. When it pulls a new event, it doesn’t execute side effects directly. Instead, it wraps the event in a WebhookEventTask and enqueues it into Asynq.
Only after the task is successfully enqueued do we acknowledge the stream message. That ordering is deliberate: we don’t consider an event “handled” until it has been safely handed off to the execution layer.
Priority Queues & Concurrency
We configure Asynq with weighted priority queues so different types of work do not compete for the same resources.
Critical system tasks such as pipeline deployments go into the default queue. Webhook delivery, which can spike in volume but is not on the replication path, goes into a low priority queue.
This ensures that a surge in webhook traffic does not starve higher-priority system operations. Even under load, core infrastructure remains responsive.
Intelligent Monitoring
Emitting a webhook for every error quickly leads to alert fatigue. Transient failures happen in distributed systems, and not every spike in replication lag or short-lived connection error requires human intervention. What matters is whether the issue persists.
For that reason, we treat critical error events such as pipeline_failed or high_replication_lag as signals rather than immediate notifications. An event indicates that something changed. A monitor determines whether that change warrants an alert.
When a worker processes a critical event, it checks whether a Monitor already exists for that pipeline and error type. If not, it creates one. That monitor owns the evaluation logic from that point forward.
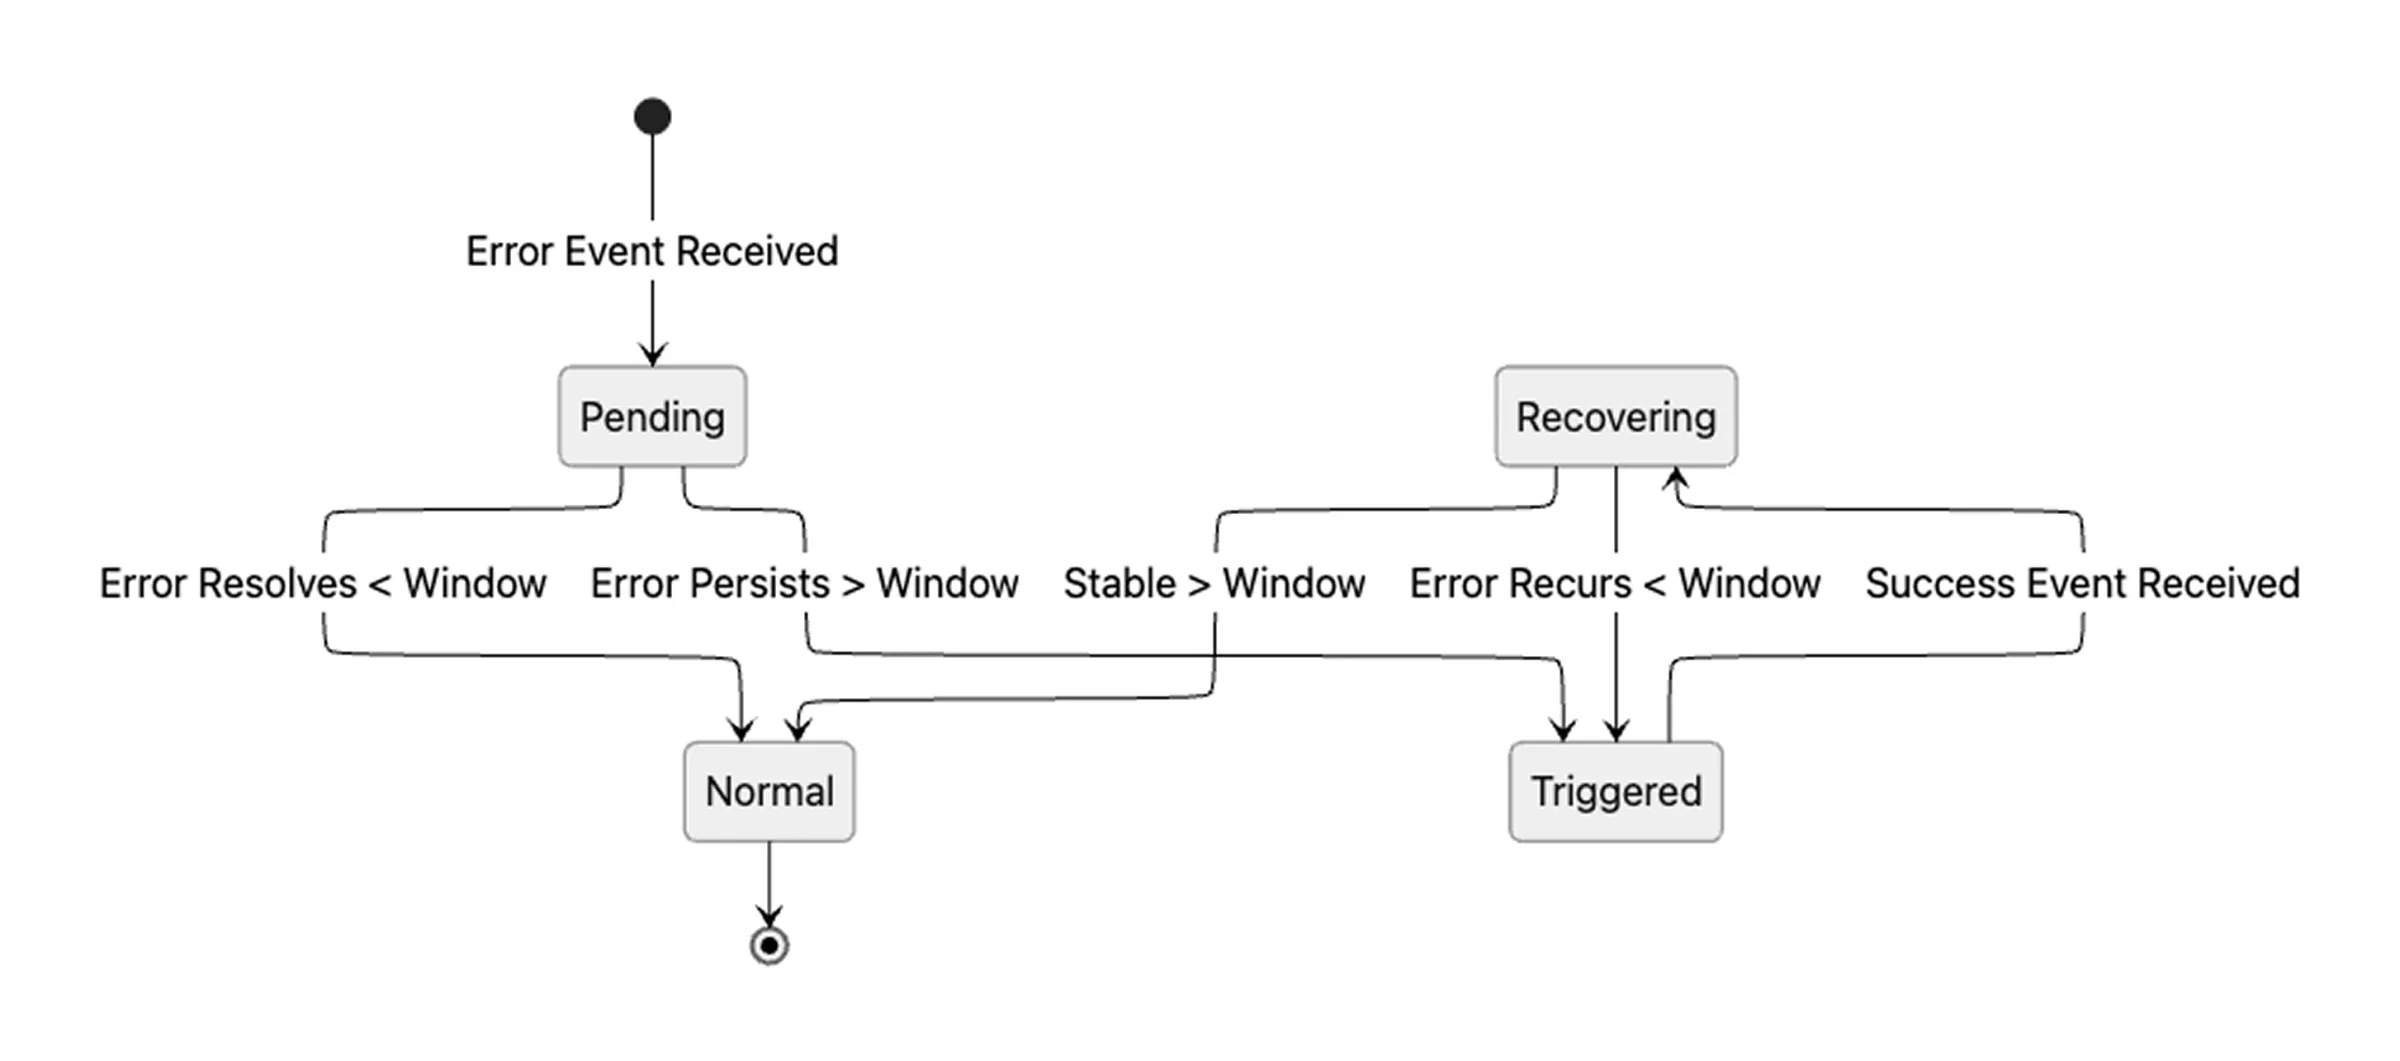
Each monitor maintains state over time. When an error is first observed, it enters a Pending state and waits for a configured trigger window. The window varies by event type. A transient network issue might use a short window of a few minutes. Sustained replication lag might use a longer window. If the condition resolves within that window, no alert is sent. If it persists beyond the threshold, the monitor transitions to Triggered and emits the webhook.
Once triggered, the monitor continues to evaluate the condition. If the issue remains unresolved, alerts are sent at a defined cadence so the problem remains visible. Recovery follows the same principle: a success event such as pipeline_synced does not immediately resolve the alert. The monitor requires a recovery window of sustained stability before transitioning back to Normal and sending a resolved notification.
The state transitions are summarized below:
Webhook Verification & Authentication
Before a webhook can receive production traffic, it must be verified. When a user creates a webhook in the Artie dashboard, we store it as unverified. Upon clicking “Verify,” we send a webhook.test event to the configured URL. If the endpoint responds with 200 OK, the webhook is marked as verified. If the URL or secret is changed later, verification is reset and must be completed again.
Only verified webhooks receive live events.
For request authentication, we support a shared secret. When configuring a webhook, the user provides a secret token, which we include in the Authorization header of every request:
This allows customers to validate the origin of the request and reject any traffic that does not carry the expected token.
Event Delivery & Retry Logic
Once a WebhookEventTask is picked up by a worker, delivery begins. At this stage, we are no longer dealing with abstract events in a stream. We are making external HTTP requests, and that means handling real-world conditions such as timeouts, retries, and partial failures.
The first step is context resolution. Raw events contain internal identifiers such as pipeline_uuid. Before sending the payload, the worker resolves those identifiers into human-readable names so the webhook is meaningful to the recipient. Instead of a UUID, the user sees something like “Production Postgres Pipeline.”
Next comes filtering and fan-out. A single event may need to be delivered to multiple destinations. One company might route pipeline_failed events to PagerDuty, while sending audit-level events to Datadog. The worker queries for all active, verified webhooks subscribed to that event type and creates a delivery task for each one.
Delivery itself is retried with exponential backoff. Network failures happen. Endpoints time out. If a request fails, Asynq retries it up to five times, with increasing delays between attempts. This gives the receiving system time to recover without overwhelming it with immediate retries. If all attempts fail, the delivery is marked as permanently failed and logged accordingly.
Every delivery attempt is recorded in our webhook_event_logs table. When a customer asks why they did not receive an alert, we can show exactly what happened, including response codes, error messages, and retry counts.
Extending the Event Stream with Downstream Consumers
Because every state change is emitted as a structured event, integrating with external systems becomes straightforward. Webhooks are simply another consumer of that event stream.
Customers commonly route events into tools they already rely on:
- Datadog can ingest Artie events alongside infrastructure metrics, making it easier to correlate replication lag with database CPU or memory usage in a single dashboard.
- Incident.io can automatically create incidents when events such as
pipeline_failedare triggered, paging the appropriate on-call engineer and initiating a structured response workflow. - Slack can receive real-time alerts directly in the channels where teams already collaborate.
Adding a new integration does not require modifying the ingestion layer.
Key Design Trade-offs
This architecture is intentionally simple, and that simplicity required trade-offs.
- Redis Streams vs. Kafka: We chose Redis Streams because it provided ordering, durability, and replay without introducing Kafka’s operational complexity. For our scale, Kafka would have been unnecessary overhead.
- Asynq vs. Standard Library: We could have implemented our own worker pool in Go, but Asynq gave us structured retries, priority queues, and visibility into task execution out of the box. The additional dependency was worth the reduction in custom infrastructure code.
- Mandatory Verification: Requiring webhook verification adds minor friction to the setup process, but it prevents accidental misconfiguration and protects external endpoints from unintended traffic.
The Core Architectural Pattern
If you are building a similar system, the core pattern is straightforward:
- Write events to a durable log such as Redis Streams or Kafka before executing side effects.
- Process events asynchronously through a worker layer that handles retries, prioritization, and failure recovery.
- Require endpoint verification before sending production traffic, for example using a webhook.test handshake.
- Log every delivery attempt for auditability.
- Treat errors such as pipeline_failed as signals, and evaluate them over time before alerting humans.
The exact tools can vary by stack. The architectural boundary – ingestion first, side effects later – is what makes the system reliable.
Conclusion
This system runs under sustained production load. In the last week, Artie replicated over 84 billion rows across customer pipelines. The webhook and monitoring architecture described here operates alongside that traffic without sitting on the critical replication path.
The core principle is simple: record facts first, derive alerts later. By writing state changes to a durable stream and evaluating them over time, we isolate ingestion from side effects, absorb transient failures, and alert only when issues persist.
That boundary – ingestion first, notification second – is what makes the system reliable.
If building and operating real-time data infrastructure at this scale sounds interesting, we are hiring. You can find open roles on our careers page


