> ## Documentation Index
> Fetch the complete documentation index at: https://artie.com/docs/llms.txt
> Use this file to discover all available pages before exploring further.
# Tuning flush rules
> Learn how to tune Artie's flush rules for optimal performance based on your destination type, data volume, and latency requirements.
## Why destination type matters
Every flush carries a fixed overhead cost - staging table creation time, time spent merging the data and any clean up work.
The key to tuning flush rules is understanding how that fixed cost relates to your destination type.
Both OLAP and OLTP destinations follow the same general flush pattern:
```mermaid theme={null}
graph LR
A[Create temp table] --> B[Load data]
B --> C[Run MERGE]
C --> D[Drop temp table]
```
The difference is how much latency each step adds.
**OLAP destinations** (Snowflake, BigQuery, Databricks, Redshift) add significantly more latency per flush. Staging requires uploading files to cloud storage, DDL operations in a warehouse are slow, and - critically - the MERGE step requires a **full table scan** because OLAP databases don't have indexes on primary keys. Every flush must scan the entire destination table to find matching rows, regardless of how many rows are in the batch. With small batches, this fixed latency dominates:
| Batch size | Overhead | Merge time | Total | Per-row cost |
| ------------ | -------- | ---------- | ------ | ------------ |
| 1,000 rows | \~5s | \~0.1s | \~5.1s | **5.1ms** |
| 100,000 rows | \~5s | \~2s | \~7s | **0.07ms** |
**OLTP destinations** (PostgreSQL, MySQL, SQL Server) go through the same steps, but transactional databases have B-tree indexes on primary keys, so the MERGE uses fast index lookups instead of table scans. Combined with lightweight DDL operations, the fixed overhead per flush is low enough that smaller, more frequent flushes work well.
## Recommended configurations
For analytical databases like Snowflake, Databricks, BigQuery, or Redshift:
Setting flush rules too low can hinder throughput and cause latency spikes:
* **Fixed overhead costs**: Each flush has connection/metadata overhead that dominates processing time with small batches
* **Inefficient resource usage**: OLAP systems are designed for large parallel operations, not frequent micro-operations
* **Storage and query degradation**: Many small files hurt compression, increase metadata lookups, and trigger excessive compaction
**Larger, less frequent flushes** are optimal because:
* Columnar storage benefits from batch processing
* Reduced metadata overhead and better compression
* More efficient query performance with fewer small files
**Example configuration:**
* Rows: 100k-500k
* Bytes: 50-500 MB
* Time: 3-15 minutes
For tables with very high write throughput, [multi-step merge](https://www.artie.com/blogs/multi-step-merge?ref=doc) can be enabled to support extremely large flush batches (1 GB+).
For transactional databases like PostgreSQL, MySQL, or SQL Server:
**Smaller, frequent flushes** work well because:
* Row-based storage handles individual record operations efficiently
* DDL and MERGE operations are fast in transactional databases
* Low fixed overhead per flush means batch size has less impact on per-row cost
**Example configuration:**
* Rows: 1k-5k
* Bytes: 10-50 MB
* Time: 30-60 seconds
## Debugging high latency
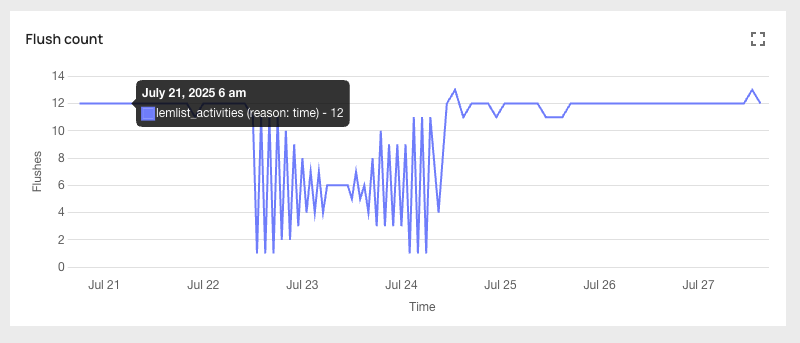
If your pipeline latency is higher than expected, use the "Flush Count" graph in the [analytics portal](/monitoring/analytics-portal) to identify which condition is triggering flushes - `size`, `rows`, or `time` - then adjust accordingly.
Look at the "Flush Count" graph to see which condition is triggering flushes.
Your flushes are triggering before enough data accumulates, producing small batches with high per-row overhead. Increase the limits toward the upper end of the recommended range:
* Rows: increase toward **500k**
* Bytes: increase toward **500 MB**
Increase the time interval (e.g., from 3 minutes to **10-15 minutes**). This may seem counterintuitive, but waiting longer allows more data to accumulate per flush, which increases overall throughput by amortizing the fixed merge overhead across a larger batch.
Look at the "Flush Count" graph to see which condition is triggering flushes.
Your batches may be too large for your destination to process quickly. Large batches in OLTP databases can hold locks longer and compete with production queries. Try reducing the limits:
* Rows: decrease toward **1k**
* Bytes: decrease toward **10 MB**
The time interval controls your maximum data freshness. If latency is acceptable but freshness isn't, reduce the time interval to flush more frequently (e.g., **30 seconds**). Since OLTP flush overhead is low, shorter intervals have minimal performance impact.
For more details on how flush rules work, see the [overview](/pipelines/flush-rules/overview).
## Monitoring
You can see which flush rule triggered each flush in the analytics portal: