> ## Documentation Index
> Fetch the complete documentation index at: https://artie.com/docs/llms.txt
> Use this file to discover all available pages before exploring further.
# Available metrics
> In this section, we will go over the metrics that Artie Transfer emits and the future roadmap.
## Today
Artie Transfer's currently only supports metrics and integrates with Datadog. We are committed to being vendor neutral, but not at the cost of stability and reliability. As such, we will be using [OpenTelemetry](https://github.com/open-telemetry/opentelemetry-go#project-status) when the library is stable.
We also plan to support application tracing such that we can directly plug into your APM provider.
## Metrics
| Name | Description | Unit | Tags |
| -------------------------------- | --------------------------------------------------------------------------------------------------------------------------------------------------------------------------- | ----- | ----------------------------------------------------------------- |
| `*.row.lag` | Difference between Kafka's high watermark (which is at the partition level) and the current message offset. | - | `groupid`, `topic`, `partition`, `table`, `mode` |
| `*.ingestion.lag.95percentile` | p95 of time lag from Kafka message was published and received.
Since Transfer `1.4.6` | `ms` | `groupid`, `topic`, `partition`, `table`, `mode` |
| `*.ingestion.lag.avg` | Avg of time lag from Kafka message was published and received.
Since Transfer `1.4.6`
If self-hosting Transfer, this is a good metric to monitor. | `ms` | `groupid`, `topic`, `partition`, `table`, `mode` |
| `*.ingestion.lag.max` | max lag from Kafka message was published and received.
Since Transfer `1.4.6` | `ms` | `groupid`, `topic`, `partition`, `table`, `mode` |
| `*.process.message.count` | How many rows has Transfer processed. | Count | `database`, `schema`, `table`, `groupid`, `op`, `skipped`, `mode` |
| `*.process.message.95percentile` | p95 of how long each row process takes. | `ms` | `database`, `schema`, `table`, `groupid`, `op`, `skipped`, `mode` |
| `*.process.message.avg` | Average of how long each row process takes. | `ms` | `database`, `schema`, `table`, `groupid`, `op`, `skipped`, `mode` |
| `*.process.message.max` | Max of how long each row process takes. | `ms` | `database`, `schema`, `table`, `groupid`, `op`, `skipped`, `mode` |
| `*.process.message.median` | Median of how long each row process takes. | `ms` | `database`, `schema`, `table`, `groupid`, `skipped`, `mode` |
| `*.flush.count` | How many flush operations have been performed. | Count | `database`, `schema`, `table`, `what`, `reason` |
| `*.flush.95percentile` | p95 of how long each flush process takes. | `ms` | `database`, `schema`, `table`, `what`, `reason` |
| `*.flush.avg` | Avg of how long each flush process takes. | `ms` | `database`, `schema`, `table`, `what`, `reason` |
| `*.flush.max` | Max of how long each flush process takes. | `ms` | `database`, `schema`, `table`, `what`, `reason` |
| `*.flush.median` | Median of how long each flush process takes. | `ms` | `database`, `schema`, `table`, `what`, `reason` |
## The what tag explained
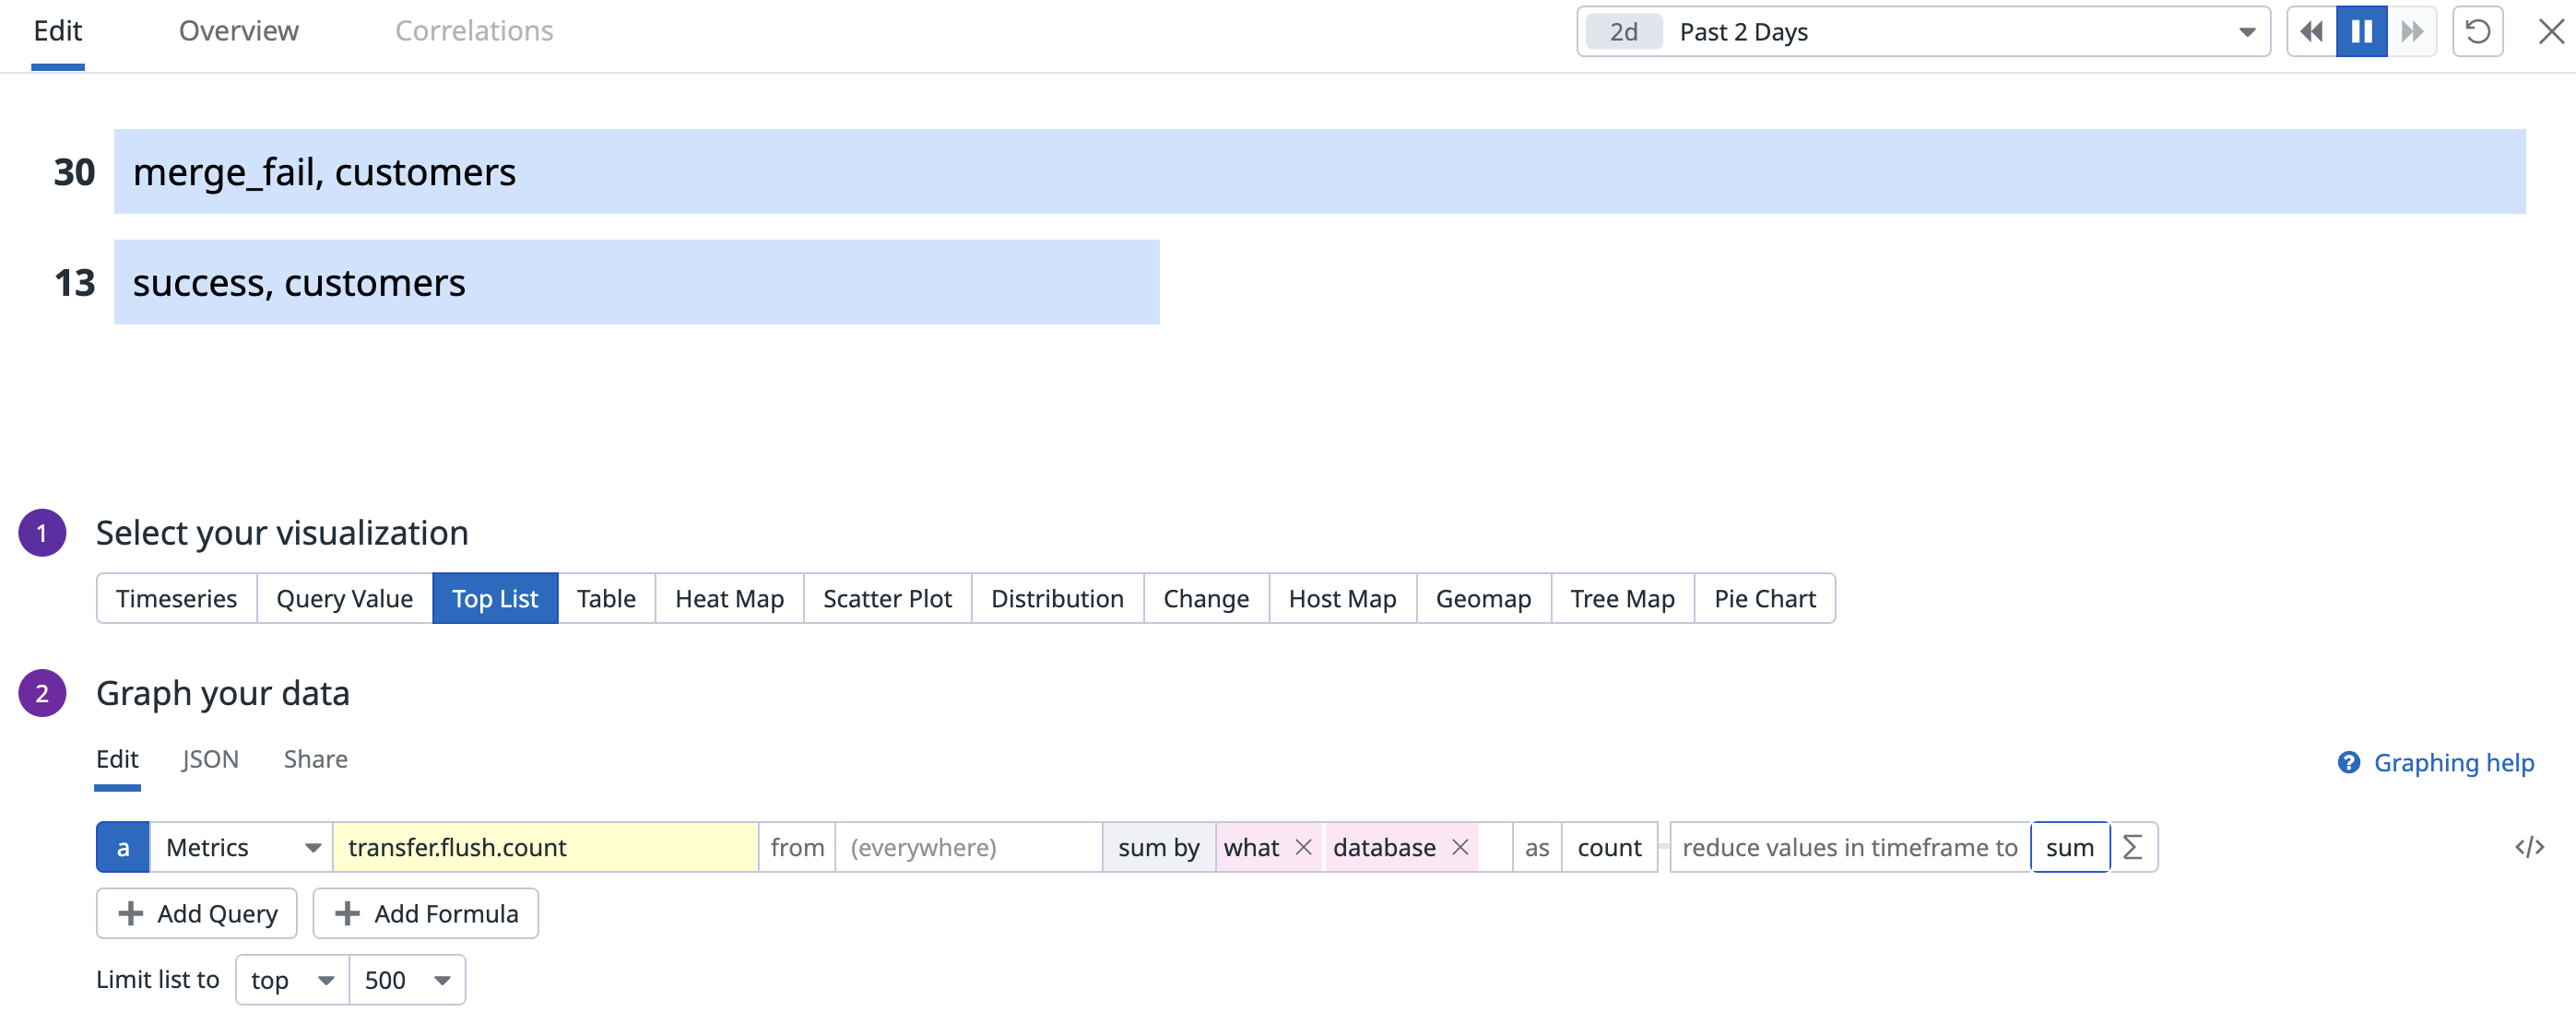
The `what` tag aims to provide a high level of visibility into whether an attempt has succeeded or not. And if it did not succeed, it will provide additional visibility into which particular operation failed (vs just providing a generic error state).
Transfer will provide `what:success` if the attempt failed and different reasoning depending on the error state. This way, our monitors and response to failures can be more actionable and we can jump straight to the offending code block.